Workshop

Experiences Teaching QGIS in the Time of COVID-19

Last year I completed what I called the QGIS Hemisphere Workshop Slam. I taught at least one QGIS workshop in the eastern, western, northern and southern hemispheres. Obviously that is not happening in 2020. It was a travel year that will likely never be repeated. From a sustainability perspective it is a good thing. From a community building perspective the lack of face-to-face meetings is challenging.

QGISWorkshops2019.jpg

Last Friday (June 12th) I taught an online 3 hour Data Visualization with QGIS workshop for FedGeoDay2020 using Zoom. It was the first time I’ve taught a virtual hands-on workshop to a large (~40) dispersed group. Last year I taught a multi-day course to a company in Canada, also using Zoom, but there were only 12, they were all in the same room and there was a facilitator. All my prior workshops have been face-to-face.

I really didn’t know what to expect. In my experience, success in a workshop depends to a large degree on: A) the skill level of the group and; B) whether they all work at roughly the same speed. This is especially true for workshops where anyone can register. This was an easy group from both of those perspectives. (I think there is another blog post coming about ideas in this paragraph)

I was pleasantly surprised with how smoothly it went. This was partly dumb luck. I am in the western US and got an afternoon time slot. The organizers had intended workshop to be run with everyone using Amazon Workstations. The machines were pre-loaded with workshop data. Unfortunately, those teaching in the morning discovered the virtual machines weren’t going to perform well and had to abandon the strategy mid-workshop. Had it worked it would have been brilliant. The whole thing was experimental and there were some lessons learned. I’m just grateful I had a chance to change course.

Hearing this news, I quickly made the data available via Google Drive and set up some instructions for software installation. When we started I provided the link and instructions. We spent the first ~10 minutes getting set up and the rest went smoothly.

ZOOM CHALLENGES

My biggest challenge teaching via Zoom is not being able to see peoples computers. I can’t help them debug. If it’s a small group they can share their screen, but this group was way too large for that. I was also worried I would have trouble pacing it. How would I know if people were finished with an exercise or needed more time?

Another challenge is managing questions via the chat box. This spring, Hans van der Kwast (my co-author for QGIS for Hydrological Modeling) and I put on a seven part webinar series. During those, one of us would teach and the other manage the chat. (You can watch all seven webinars, one per chapter, on YouTube here). It worked brilliantly and the turnout was phenomenal. We had 373 people register representing 86 countries!

However, for last weeks workshop I was solo. In preparation, I read Ujaval Ghandhi’s post where he shares his experiences teaching online and tried to prepare accordingly. I also read Andrew Cutts post. I recommend them both!

WHAT WORKED

Here are the strategies that worked well for me:

  • To keep track of peoples progress, I had them either use Reactions (give me a thumbs up when they finished a section), or give me some indication via the Chat box. I could also tell it was fast group and that they seemed to be working at the same pace. That’s just luck.

  • For other large groups I’ve been in the habit of using animated gifs for teaching. These allow the workflow to “play” onscreen while I walk around the room helping people. It’s really effective. I hoped this would work equally well in this situation and it did. I could leave a slide up and while people were watching I could monitor the chat window and answer questions.

  • Lastly I gave a 10 minute break every hour.

We got through all the material in the 3 hour session and I had positive feedback.

I hadn’t planned on recording the session. However, someone asked about it and it’s easy to do via Zoom. I did some minimal editing to give a nicer opening and take out the breaks. The workshop is available in its entirety here.

OTHER ONLINE EVENTS:

So far, during the COVID-19 pandemic, I’ve had great experiences with webinars and now a workshop. I’ve also really enjoyed watching webinars and conferences others have put on. Nyall Dawson recently taught two must see webinars (QGIS 3.14 time handling and map animation & QGIS Expressions, variables, and data defined settings: putting it all together). Then this week OsGeo:UK hosted the virtual FOSS4G UK Online 2020 conference which was fantastic. I understand videos will be coming in the next week. One I recommend watching is Steven Feldman’s (@StevenFeldman) talk Running an Online FOSS4G - some reflections. He gave a really thoughtful overview of the future of FOSS4G conferences. Nick Bearman’s talk on Teaching QGIS: Certification and Running QGIS in the Cloud, I missed, and look forward to checking out. I also recommend Jorge Gaspar’s (@xurxosanz ) review of the FOSS4G UK Online conference! I am happy to see all of these events be so successful. They help democratize learning technology. They have been free and open to anyone. They also help maintain our community connection.

Next month QGIS-US is hosting a one to two day conference: QGIS North America 2020. Then in August I will be working with the Australian Water School on a webinar series: QGIS for preparing and visualising hydrological data.

Time zones are the biggest hurdle for live events. One solution is recording them and making the content available, as most are doing. For the foreseeable future these are how our communities will be meeting, and thankfully it’s working.
The ASTHO Summit on Climate and Health

During the last week of May I traveled to the island of Oahu in Hawaii to participate in the Association of State and Territorial Health Officials (ASTHO) Insular Area Climate and Health Summit. It was a small intimate meeting organized by ASTHO. It was held at the Ala Moana Hotel with representatives from most of the U.S. territories including:

  • American Samoa
  • Commonwealth of the Northern Mariana Islands
  • Federated States of Micronesia
  • Guam
  • Palau
  • Puerto Rico
  • Marshall Islands
  • U.S. Virgin Islands
  • Hawaii Department of Health 
  • Pacific Island Health Officers Association (PIHOA)

The ASTHO Summit on Climate and Health group photo

The first afternoon was focused on the impacts of climate change, preparedness and building resilience. There were great presentations on climate change (Capt. Barry Choy - NOAA), an overview of the tools and programs available from the CDC (Paul Schramm), and issues around vector-borne diseases and mosquitoes (Janet McAllister). 

Then there were some very humbling and sobering presentations on current issues people are having in the Mariana Islands, Micronesia and the U.S. Virgin Islands. Sea level rise and hurricane recovery were the main topics. I heard first hand, stories of people dealing with climate change impacts now. This was nothing hypothetical. These were real people dealing with catastrophic current impacts. Compounding this were stories of how many islands have such small populations that they frequently fall off federal priority lists.

For example, in Micronesia they are working on a salt water tolerant taro variety. They hope this will help farmers produce food, even with rising seas. The Virgin Islands & Puerto Rico were hit by back-to-back Category 5 hurricanes last September: Irma and then, two weeks later, Maria. Many there are still in survival mode. They used to think of being ready for a week long disaster. They are now planning on months. They need to know basic things, like where all the backhoes are. Climate change is here and the people dealing with the biggest early impacts had very little to do with the cause.

The first afternoon

The second day focused more on tools and resources which was why I was invited. There were more detailed talks given by the CDC on vector control, especially from mosquitoes. That afternoon I taught a 3.5 hour Community Health Maps Train-the-Trainers workshop to a group of health officials from each territory. The idea was that they could train their colleagues once back on their islands. We went through the entire CHM workflow: A) how to design a data collection form using Fulcrum, B) how to collect data using smartphones, C) how to make a map in Carto and D) how to bring the data into QGIS.  

Onasai'i Aulava & Ruta Ropeti from American Samoa learning to use Fulcrum

John Tagabuel from the Commonwealth of the Northern Mariana Islands learning to use Fulcrum

The last morning I taught a second Community Health Maps workshop open to everyone. I had about 30 attendees and again went through the entire CHM workflow.

The week was a reminder of how those of us working with technology day-to-day sometimes take it for granted. Everyone was super excited to have this training. It was also a lesson in how resource rich we are on the continent. One of my goals with Bird's Eye View is to use technology to help make the world a better place. (Thus my focus on conservation, public health and education.) One of the goals of the Community Health Maps program is to empower people with technology. This week fulfilled both and was very gratifying.

Most of the trainees had little to no GIS training yet instantly knew how mapping could apply to their work and lives. They want to map everything related to hurricane relief, salt water resistant taro farms, infrastructure related to mosquito outbreaks etc. A benefit of having the community do this is that they can be in charge of their own data and it helps build community relationships. 

One afternoon the officials from American Samoa wanted to see how well the basemaps available in Carto and in QGIS via QuickMapServices represented their home. I opened up OpenStreetMap and zoomed to Pago Pago, American Samoa. It was pretty feature rich and they were surprised and excited. 

2018-06-25_141334.jpg

During the closing session the ASTHO organizers went around the room and asked people to give their closing thoughts. I was amazed to hear person after person say they wanted more training from Kurt. It was great feedback. There seems to be a lot of potential for CHM, and FOSS4G generally, to help U.S. Territories and ASTHO deal with the immediate and long-term health issues related to climate change.

It felt like making real connections with people was easy. That's the way the best meetings/conferences feel. I hope to travel to some of these islands and teach more in depth workshops to get people really up and running with QGIS. I also plugged FOSS4G Oceania and hope some take advantage of the travel grant program!

Farewell shot with my new friends from American Samoa

A QGIS Workshop at the Society for Conservation GIS (SCGIS)

Last Sunday I taught a full day Introduction to QGIS workshop at the 2017 SCGIS conference in Pacific Grove, California. While I've taught this course many times before, this class was particularly unique because SCGIS, although an independent non-profit organization, is heavily sponsored by Esri. In addition, Max Wright with Conservation International, also taught a QGIS workshop entitled An Introduction to Predictive Land-use Change Modeling using Open-source Software, making 2 of the 4 workshops at SCGIS QGIS based. Certainly a first! 

A QGIS workshop at an Esri sponsored conference?!

A QGIS workshop at an Esri sponsored conference?!

My workshop was sold out with a waiting list and I eagerly anticipated meeting the participants. Almost universally attendees were either:

  • Mac users and/or
  • Looking for work and wanting some new skills

I expected there to be some ArcGIS power users from established conservation organizations who were just curious about QGIS, but there wasn't anyone who fit that description. 

Overall QGIS was very well received. During the morning session I introduced FOSS and QGIS, showed how to add and style data and create a map. At lunch one attendee said,

"I have about 10 pet peeves with ArcMap, and you just answered 7 of them with QGIS!"  

During the afternoon session I covered plugins, geoprocessing, the Graphical Modeler and how to get help/resources. If you missed it, all the workshop materials can be downloaded here.

One of the most interesting aspects of SCGIS is their International Scholar program. In attendance were a couple dozen scholars from around the world. I met people from Barbados, Zimbabwe, Madagascar, Brasil, Columbia, The Gambia, Bangladesh, New Zealand, Pakistan, and Zambia. It was really fun connecting with people from such different places working on conservation.

Then there was the location. We were at the Asilomar Conference Grounds on the Monterey Peninsula. The waves on the beach could be heard from our room and each night I went out to the beach to enjoy the sunset. I also had time to visit the Monterey Bay Aquarium and go on a whale watching tour!

One thing I realized is that many don't seem to look far beyond the Esri ecosystem for geo-tools. I've been an Esri user for 20 years, I get it. There are some great products in the stack. However, I hope more SCGIS'ers eventually venture to a FOSS4G conference. I think it would be immensely helpful to their work. The set of FOSS tools discussed there is so broad and interesting. Afterall GIS is just a tool, why not have a bigger set of tools to work with? Certainly having two QGIS workshops at SCGIS is a step in the right direction. 

I had some discussions with another SCGIS attendee about doing a workshop next year on how to work with LandFire products with QGIS. I'll keep you posted on that.  Next up is the 3rd QGIS User Meeting/Hackfest/Developer Meeting in Nødebo Denmark where I'll be teaching a full day workshop on Data Visualization and Cartography in QGIS!

The Concise 2015 Year in Review...A Good Year!

Professionally

Personally

  • Celebrated my grandmothers 100th birthday
  • Travelled to Denmark, Vermont, New York City, San Francisco, Colorado, Bisbee AZ and Charleston SC.
  • Worked out 184 times...not bad for an aging GeoHipster!
  • Walked 370 miles...ah technology!
  • Climbed my 20th 14’er (Mt Yale)...a work in progress
  • PR bench press – 215lb 3x
  • PR dead lift – 300lb – 5x
  • PR back squat – 205lb – 4x


Bird's Eye View Conducts a Training in the South Carolina Lowcountry

Recently Kurt Menke headed to Charleston, South Carolina to train several groups how to map their communities. This was part of the Community Health Maps project with the National Library of Medicine. This region is also known as the ‘lowcountry’ due to the flat, low elevation geography. The training was hosted by the Medical University of South Carolina (MUSC) and included people from Communities in Schools – Charleston (CISC) and the MUSC School of Nursing.

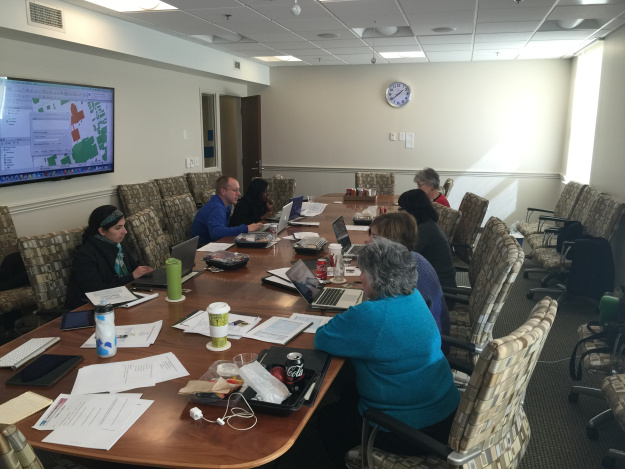
MUSC Community Health Mapping Training at the School of Nursing

First everyone learned how collect GPS field data with iPads. For this we used a new app named iForm. This app was used in lieu of EPI Collect, which no longer supported on iOS.  iForm is an app very similar to the Android app ODK Collect, allowing a custom data collection form to be developed. To practice we collected bike rack locations  and seating areas around the MUSC campus. The afternoon was spent working with everyone’s  data. GPS data points were brought into QGIS and shown against some local Charleston GIS data layers.

MUSC Data Points in QGIS

The points were also uploaded to CartoDB. CartoDB is another new component of the Community Health Mapping workflow. It has become more intuitive than GIS Cloud and worked really well. (Note: There will be a post on using CartoDB soon too.)

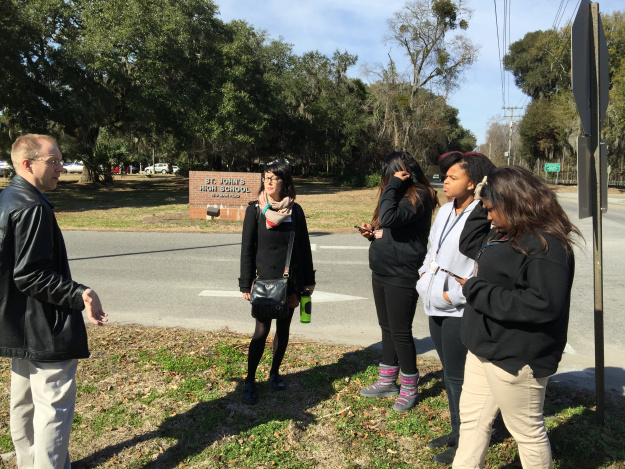
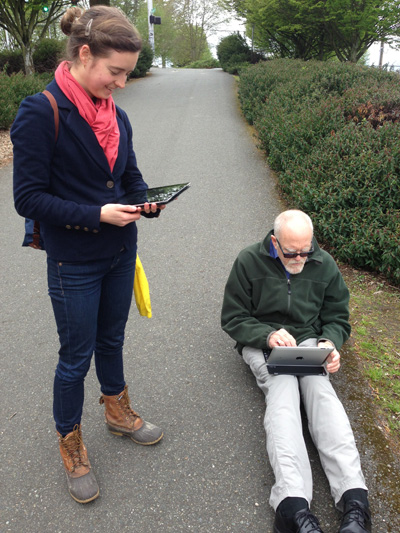
The following day I visited CISC’s Derek Toth and three of his students at St. John’s High School on John’s Island, SC. Over a working lunch Mr. Toth showed students how easy it is to collect GPS points with their iPhones. We collecting several points while walking around the campus.

Mapping the St. Johns Campus

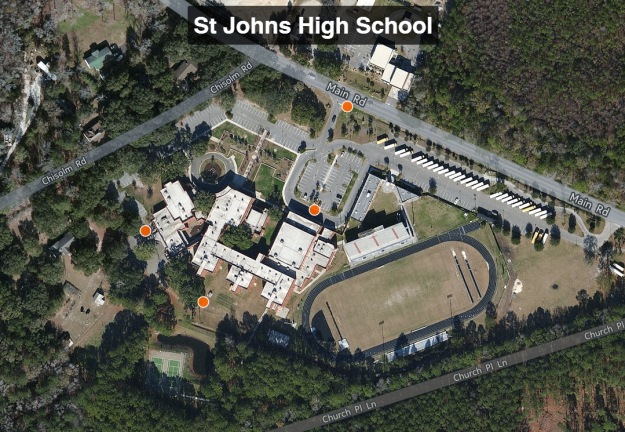
Afterwards we went back inside and showed them how to upload the points into CartoDB and make a map. The figure below shows the results of 45 minutes worth of work! Click on the map to open the live version.

St Johns High School Data Points in CartoDB

This spring these three juniors will be leading the charge to map their island!  They will be presenting their work to the National Library of Medicine later this spring. I look forward to seeing their work!

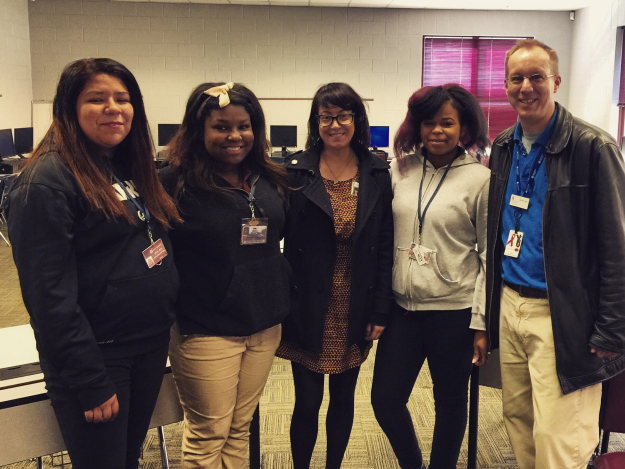
The St. Johns High School Mapping Team from left to right: Jocelyn Basturto, Khatana Simmons, Candace Moorer (MUSC), Corrieonna Roper & Derek Toth (CISC)

Low Cost Tools for Mapping Community Public Health

The past week was spent conducting training sessions on how to use a low cost workflow for public health mapping in minority communities. Trainings were conducted at two sites. The first site was the Urban Indian Health Institute in Seattle, Washington. They are monitoring noise pollution in urban indian populations. The other Papa Ola Lokahi in Honolulu, Hawai'i. They are working on a community public health assessment. The workflow starts with data collection using iPhones/iPads, moves into working with the the data in QGIS and finally data presentation via GIS Cloud.

Taking GPS and decibel readings in Seattle.There is an ever expanding ecosystem of geospatial apps for iOS. For this project we are evaluating EPICollect and GIS Pro. EPICollect is a free app designed to collect point data with a custom form. GIS Pro is a very expesive app. However, with the price comes a very intuitive and robust data collection system. 

An assortment of mapping apps for iPad

Once data is collected QGIS is used to combine the data with other organizational datasets, conduct spatial analyses and prepare maps. GIS Cloud is being used for final online presentation.

FOSS4G Workshop for Educators at FOSS4G

This fall Bird's Eye View (with the support of the GeoTech Center) will be holding the FOSS4G Workshop for Educatorsat the Free and Open Source Software for Geospatial Conference (FOSS4G) in Denver, Colorado. This is exciting for at least two reasons. Having the FOSS4G Conference in North America, let alone the United States, is fairly uncommon. In recent years it has been held in Australia, South Africa and Spain. Secondly, the workshop will premier one of the only FOSS GIS curricula in the United States. Entitled Introduction to Open Source GIS and Web Mapping, it is currently being taught at Central New Mexico Community College.

Free and  open source software comprises one of the fastest evolving sectors of GIS. While FOSS GIS software has been around since the 1980's, recent years have seen the software becoming much more mature and user friendly. There are great FOSS GIS products for the desktop, web server, web client, spatial database and mobile GIS. Historically, ease of access and installation has been a major hurdle for those wanting to transition to FOSS GIS software. Now there are intuitive Windows installers for all the leading packages.

The course is expected to become increasingly important to the CNM program. In New Mexico, employers are starting to favor applicants with knowledge of both ESRI and FOSS applications. This is in part due to the economic times. Students at CNM and elsewhere learn GIS in pure ESRI environments. Most are shocked to discover how many capable FOSS GIS software packages exist.

The course sticks to a pure FOSS paradigm. For example, assignments and lectures are provided in Open Office versus Microsoft Office. The students are not introduced to much new GIS material in the course, save web mapping. Rather they are shown how to do things they have learned in other foundational courses using FOSS GIS software. The packages used include: Quantum GIS, GRASS GIS, GDAL/OGR, SpatiaLite, PostgreSQL/PostGIS, and MapServer. They are also introduced to open standards and open data. Midway through the semester they are given a final project assignment. For this they research a FOSS GIS package not being covered in the course lab, and during  the last week of class they present their findings to the class. This exposes the students to a large number of new tools.

The web mapping portion is an introduction to web mapping and the web in general. Part of the overall goal for the course is to make it accessible to students who have completed the Introduction to GIS course. So, this course has no programming requirement. Google maps (although no open source) is used as a gentle introduction to web mapping. Then students move on to labs where they use MapServer to create basic web mapping applications.

The workshop this fall will target educators wanting to incorporate FOSS GIS into their curricula, or those who are just curious about what FOSS GIS is and what it can do. The course goals, readings, labs and exam structures will be shared. Attendees will also get to try their hand at a lab or two. For more information visit the conference workshop page.